Thomae's function
Thomae’s function (a.k.a. Riemann function) is defined on the interval (0, 1) as follows
Here is the graph of this function with some points highlighted as plus symbols for better view.
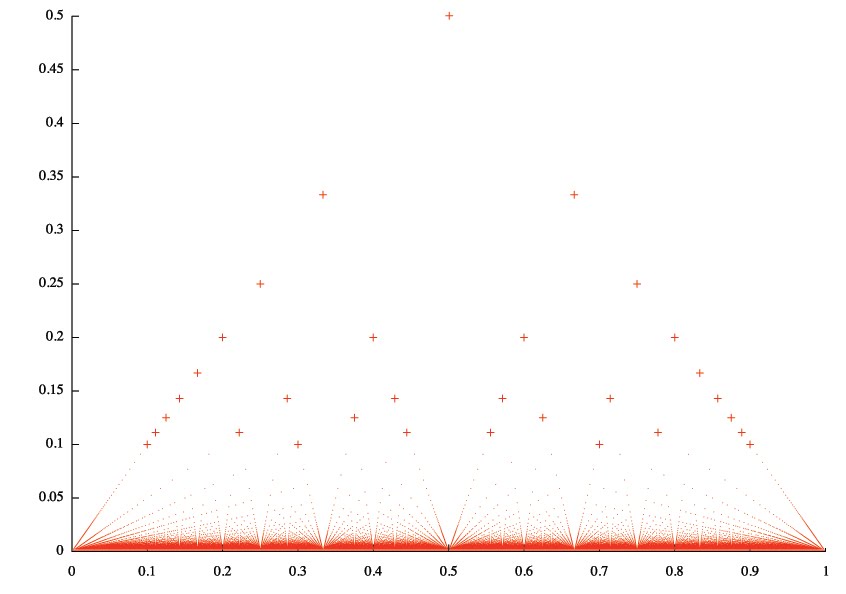
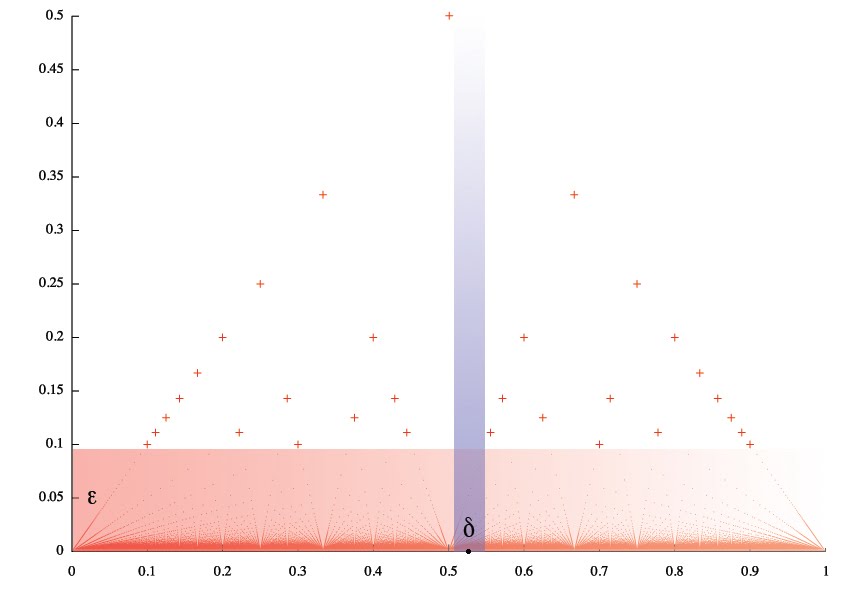
This function has interesting property: it’s continuous at all irrational points. It’s easy to see this if you notice that for any positive ε there is a finite number of dots above the line y = ε. That means for any irrational number x0 you can always construct a δ-neighbourhood that doesn’t contain any dot from the area above the line y = ε.
To generate the data file with point coordinates I wrote Common Lisp program:
(defun rational-numbers (max-denominator)
  (let ((result (list)))
    (loop for q from 2 to max-denominator do
      (loop for p from 1 to (1- q) do
        (pushnew (/ p q) result)))
    result))
 (defun thomae-rational-points (abscissae)
  (mapcar (lambda (x) (list x (/ 1 (denominator x)))) abscissae))
 (defun thomae (max-denominator)
  (let ((points (thomae-rational-points (rational-numbers max-denominator))))
    (with-open-file (stream "thomae.dat" :direction :output)
      (loop for point in points do
        (format stream "~4$ ~4$~%" (first point) (second point))))))
 (thomae 500)
To create the images I used gnuplot commands:
plot "thomae.dat" using 1:2 with dots
plot "thomae.dat" using 1:2 with points
and Photoshop.